

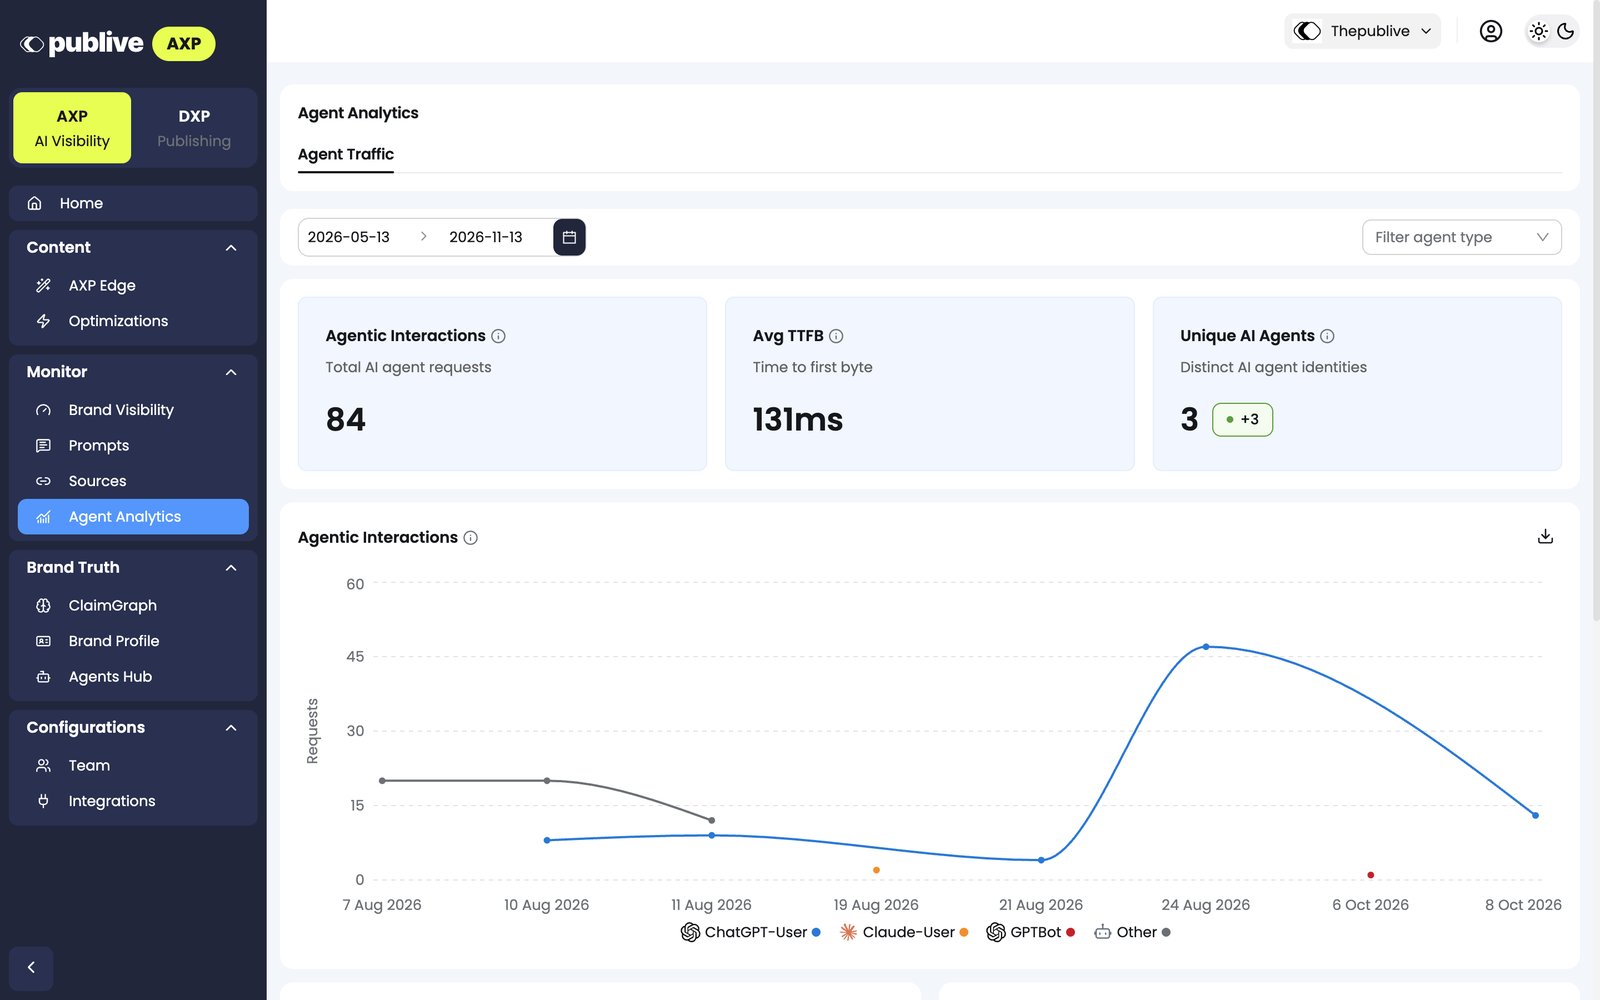
Filters
- Date range: The default range is the last 6 months.
- Filter agent type: Show the data for one AI agent, for example
GPTBotorClaudeBot.
Headline metrics
Agentic Interactions chart
The chart shows the AI agent requests over time. Each line is one AI agent, for example ChatGPT-User, PerplexityBot, or GPTBot. Click Download chart to download the chart.Top Movers and Bottom Movers
- Top Movers shows the URLs with the largest increase in AI agent traffic in the date range.
- Bottom Movers shows the URLs with the largest decrease in AI agent traffic in the date range.
URL Performance Analysis
This table shows each URL on your domain with its AI agent traffic.- To find a page, use Search by URL.
- To filter the list by URL path, click Filter. You can add more than one filter.
- To copy the URL of a page, click the copy icon.
Next steps
AXP Edge dashboard
See which pages AXP Edge optimizes, and set rules for AI agents.
Brand Visibility
See how often AI assistants mention your brand.